1). Magnetic and Gravity Data Processing, Visualization, Analysis and Interpretation
Encom Profile Analyst provides geophysicists with the ability to process, filter, grid, and map data from gravimeter and magnetometer surveys. you can see and compare all your line data, profiles, grids, modelling, images, maps and 3D visualisations in a single interactive interpretation environment. A full range of analytical functions, effective presentation tools and powerful template capabilities help you to complete your expert analysis more quickly, comprehensively and effectively.
Use Profile Analyst to:
- Connect geophysical data, modelling, satellite imagery, geochemistry and geological mapping in a single interactive interpretation environment
- Coordinate and streamline repetitive tasks and procedures
- Configure powerful templates for greater control
- Combine sophisticated line analysis techniques with map and image analysis
- Create maps, or cut and paste results into other applications
Encom PA Packages
You can choose between two licensed packages, PA Explorer and PA Professional.
Encom PA Explorer
Encom PA Explorer contains all visualization methods (in curve profiles, section profiles, 2D maps and 3D displays), data linking, import utilities and basic processing, conversion and most display utilities.
PA Professional
Encom PA Professional includes all modules available in PA Explorer plus a number of additional utilities for extending the interpretation functionality of Encom PA, such as digitising features in 1D, 2D and 3D.
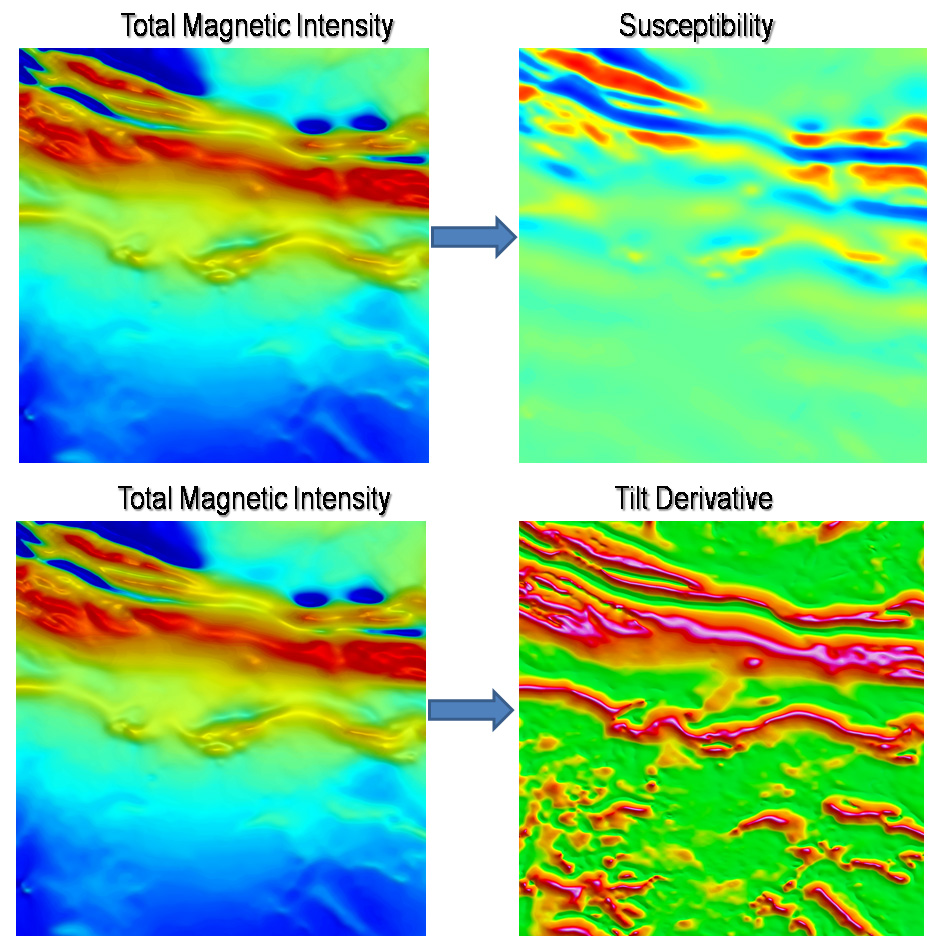
A). Ground Magnetic Survey Result
2). Induced Polarization and Resistivity Data Processing, Analysis and Interpretation
Induced polarization (IP) and resistivity surveys are common geophysical methods used to investigate subsurface properties for various applications like mineral exploration, groundwater studies, environmental assessments, and engineering projects. Here’s a general outline of the data processing steps for both IP and resistivity surveys:
1. Data Acquisition:
- Both IP and resistivity surveys involve collecting measurements of the electrical response of the subsurface to applied electrical currents. The data is collected using arrays of electrodes placed on the ground surface or in boreholes.
2. Quality Control:
- Ensure that the collected data is of good quality by checking for issues such as noisy measurements, equipment malfunctions, or environmental interference.
3. Pre-processing:
- Remove noise and artifacts from the raw data using filters or other noise reduction techniques.
- Correct for instrument drift and other systematic errors.
- Ensure proper geometric correction, accounting for electrode spacing and layout.
4. Data Interpretation:
For Resistivity Surveys:
- Convert raw data into apparent resistivity values.
- Apply inversion algorithms to model the subsurface resistivity distribution. Common inversion techniques include:
- 2D and 3D inversion algorithms such as Occam’s inversion, smoothness-constrained inversion, or least-squares inversion.
- Forward modeling to simulate resistivity data for various subsurface models and compare with measured data to refine the model.
- Interpret the inverted resistivity models to infer subsurface structures, lithology variations, or fluid content.
For Induced Polarization Surveys:
- Process raw data to extract chargeability and resistivity values.
- Apply inversion algorithms to model the subsurface chargeability distribution. Common inversion techniques include:
- Time-domain and frequency-domain inversion methods.
- Multi-electrode or multi-frequency approaches to enhance resolution and accuracy.
- Interpret the inverted chargeability models to identify mineralization, fluid-filled structures, or other geological features.
5. Integration and Analysis:
- Integrate the results of resistivity and IP surveys with other geological, geophysical, and geochemical data to provide a comprehensive understanding of the subsurface.
- Analyze the interpreted models to make informed decisions regarding mineral exploration targets, groundwater resource characterization, or site investigation for engineering projects.
6. Reporting:
- Prepare reports summarizing the survey objectives, methodology, data processing steps, and interpretation results.
- Provide visualizations such as maps, cross-sections, and 3D models to communicate the findings effectively.
Each step of the processing workflow requires careful attention to ensure the accuracy and reliability of the final results, and the specific details may vary depending on the survey objectives, site conditions, and available data. Additionally, specialized software packages are commonly used for data processing, inversion, and visualization in both IP and resistivity surveys.
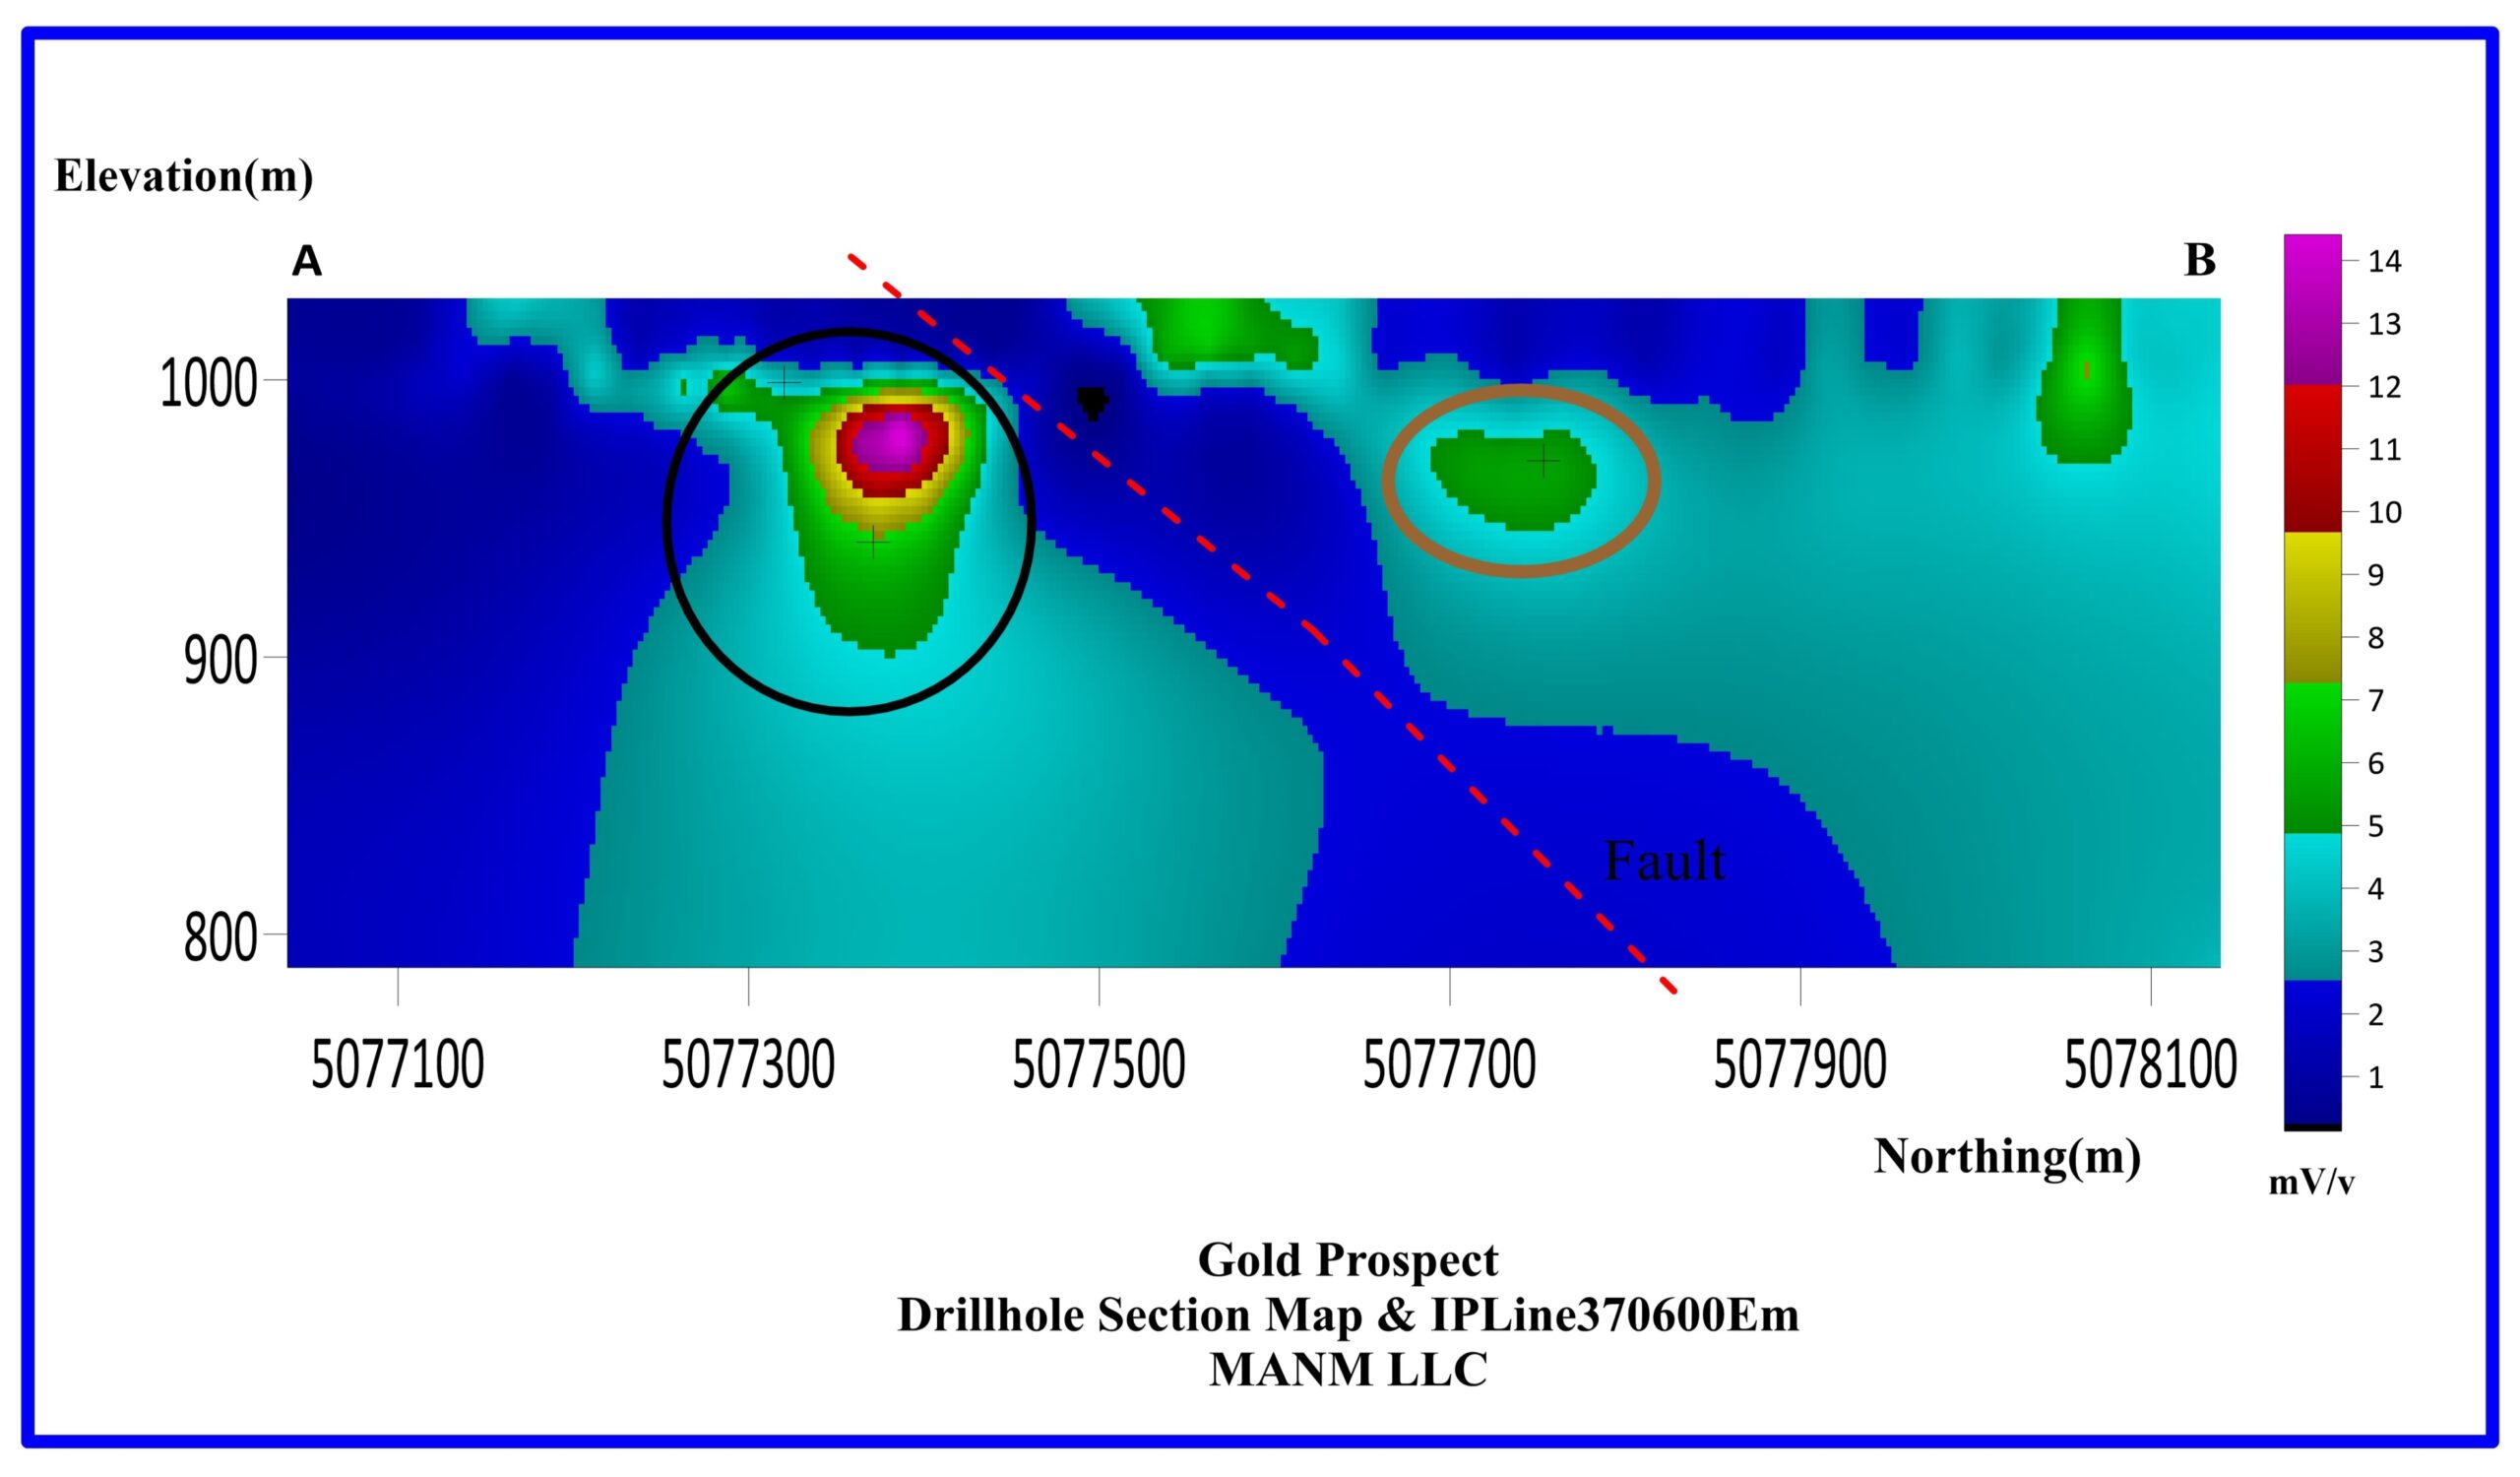
B). Induced Polarization and Resistivity Survey Result
RES2DINV is the 2D resistivity and IP inversion software. Besides normal land surface surveys, it also supports underwater and cross-borehole surveys. In addition to the standard Wenner (alpha, beta, gamma), Wenner-Schlumberger, pole-pole, pole-dipole, inline dipole-dipole, equatorial dipole-dipole arrays; it also supports non-conventional electrode arrangements.
RES3DINV is the 3D resistivity and IP inversion software, and it is probably the first widely available commercial software of this type. 3D surveys are more time-consuming and expensive to carry out, but could be useful for very complex geological situations. To reduce costs to the user, RES3DINV is sold as a combined package with RES2DINV which costs only about 25% more than the RES2DINV program alone. It is probably more than an order of magnitude faster than some other commercially available 3D inversion software.